|
Powered by |

|
Follow us: |


|
|
| Intraday Charts |
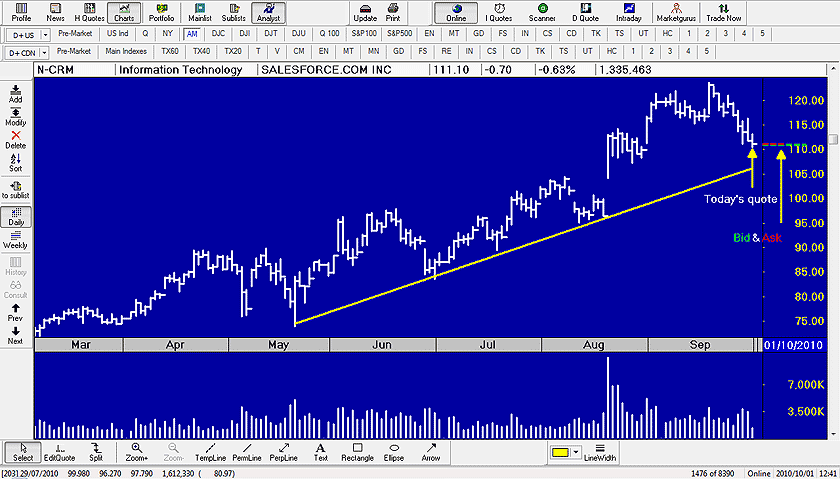
Let’s first recapitulate the functioning of the historical charts updated to the present moment (accessible by clicking on the icon with the chart image in black and white).

In the main chart screen (F4) of Marketvisionplus, you look at the historical graphs. Using the arrow keys down and up, or the mouse wheel, you can scroll through the charts of the active list.
The F4 key acts as a switch. By clicking it several times over, you go from daily quotes chart up to 250 days (one year), to the weekly quotes charts up to 250 weeks. The keys 1 to 5 on the keyboard show you the last 50 to 250 periods.
When the Online button is not enabled, the charts will show the chosen historical period, up to the previous trading session. When the Online button is enabled, a request to the server of Decision-Plus will add the quote of the day to each consulted chart. This quote will be in real time or delayed depending on your subscription. Note that the supply and demand are represented in the pricing grid by the red and green lines. The height refers to the price of the supply and demand. The length of the lines from left to right represents the size of the supply and demand.

Intraday Charts
At any time, regardless of the window where you are, whether in the profile, News, Quotes or Chart mode, you are always in a list and the cursor is always on a stock or index. There is always an active stock.
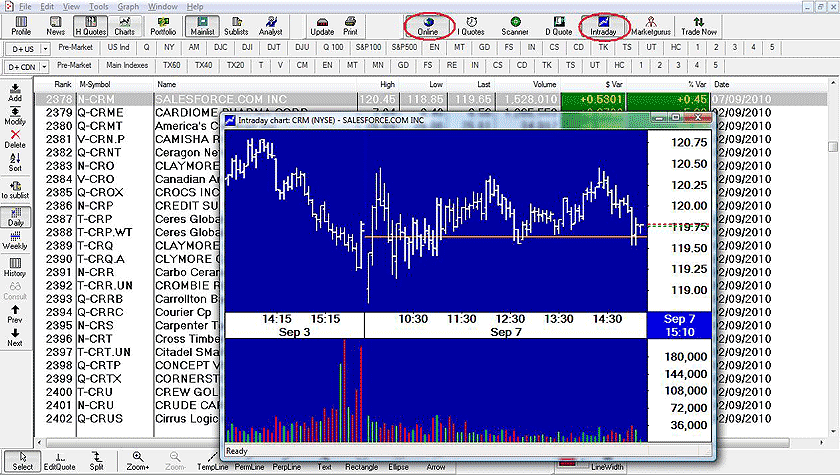
When you click on the Intraday button of the Online mode (white chart on a blue background) you get an intraday chart of the active stock. The charts are available in minutes or hours up to the present moment if you are a subscriber in real time, otherwise it is delayed 15 minutes on the Canadian market and 20 minutes on the U.S. market.


Each time you click on the Intraday button of the online bar, you get an intraday chart of the active stock. These charts will be displayed using the default setups.
If you right click on the chart button, you get the settings table that you can use to change the time intervals, analysis, color and many other things, so that in the future you have intraday charts tailored to your needs.
Previous Page
|
Menu
|
Next Page
|