|
Powered by |

|
Follow us: |


|
|
| Visual tracking of your strategies, decisions and predictions |
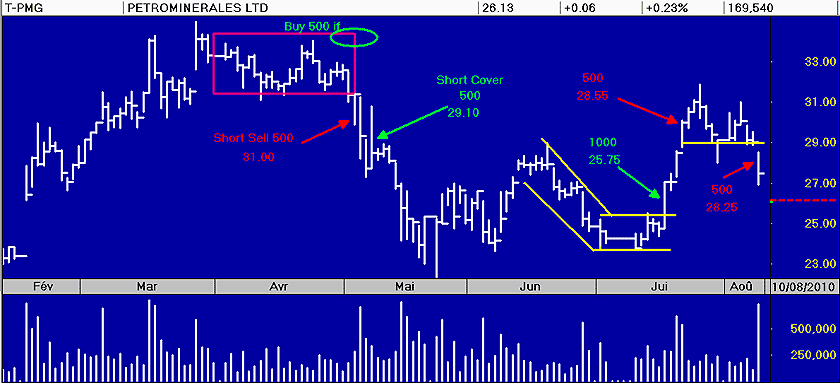
To visually track your decisions and predictions, you can write down your actions on the chart of each position you hold in a portfolio. You could also do it on a list of stocks that you follow by specifying your transactions and future strategies.
Using the toolbar, you can use the lines, arrows, circles, rectangles and text to describe almost anything. You will save a lot of time and it will much easier for you to follow your decisions and strategies.
Define your personal code: 1000 $ 7.98 in green with a line can point to the place where you bought that 1000 units at that price. 500 $ 9.25 in red can point to the place where you sold half of your position at that specific price.
Some people note the intention to buy or sell by a purple rectangle defining an area to penetrate to meet the point of purchase or sale. Imagine your own code and remember the good and bad shots.
Imagine yourself scrolling the stocks of your portfolio while viewing each of your decisions. There is no better way to set things right.

Previous Page
|
Menu
|
Next Page suivante
|